 English
 Français
Introduction
This example is about the evaluation and the comparison of different IT outsourcing projects. To get a quick overview, take a look at the video below or keep on reading for detailed explanations.
Production Inc. will outsource a few projects but needs to identify in which projects it is going to invest its money. Six different projects are being evaluated and are noted Project A, Project B, … Multiple criteria are taken into account in the evaluation process :
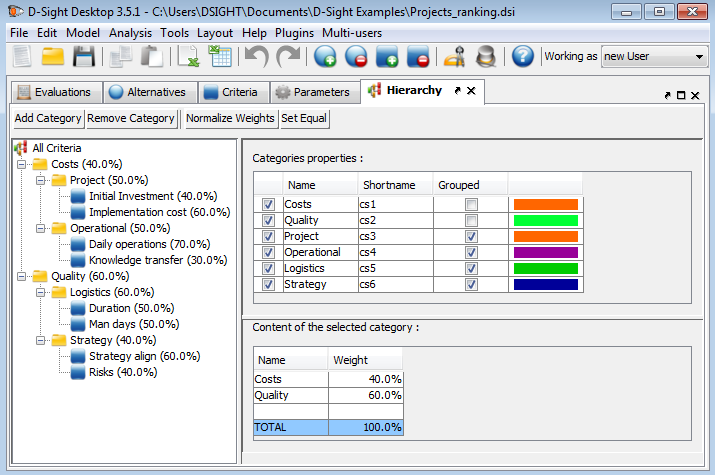
- Costs
- Project: those criteria reflect the direct costs visible to Production Inc.
- Initial Investment: this is the cost of additional components that need to be added to the infrastructure (for instance new servers, new network routers ...). It is expressed in Euros.
- Implementation cost: this is the cost of labor necessary to implement the project (installation, configuration, integration ...). It is expressed in Euros.
- Operational: this reflects the costs once the project has been completed and that it is fully functional (i.e. put in production)
- Daily operations: this is the difference of costs between daily operations before the implementation of the project and once it is completed. If the system is less expensive to work with on a daily basis, it can therefore contain negative values. It is expressed in Euros.
- Knowledge transfer: this is the price of transferring the knowledge from the people who realized the project to the people who will maintain the solution in place. It is expressed in Euros.
- Project: those criteria reflect the direct costs visible to Production Inc.
- Quality
- Logistic: this subcategory reflects the planning of the project in terms of required efforts and length
- Length: this is the expected length of the project, from the planning phase until it is deployed into the production environment. It is expressed in days.
- Man days: this is the required effort and it highlights how much time the different resources working on the project are going to spend. This is expressed in Man Days (MD) where 1 MD is the time spent by one resource during one day (8h). This criterion is not directly related to the length of the project as it depends of the time repartition.
- Strategy: this subcategory assesses how the projects align with the strategy defined by the executive team of Production Inc and what are the risks involved with the implementation of the project.
- Strategy alignment: this criterion measures against a qualitative scale how the project is aligned with the predefined strategy of Production Inc. The scale is [10%; 20%; 40%; 60%; 80%; 100%].
- Risks: the risks associated with this project is expressed against a qualitative scale [no risk; low; medium; high] defined internally by Production Inc.
- Logistic: this subcategory reflects the planning of the project in terms of required efforts and length
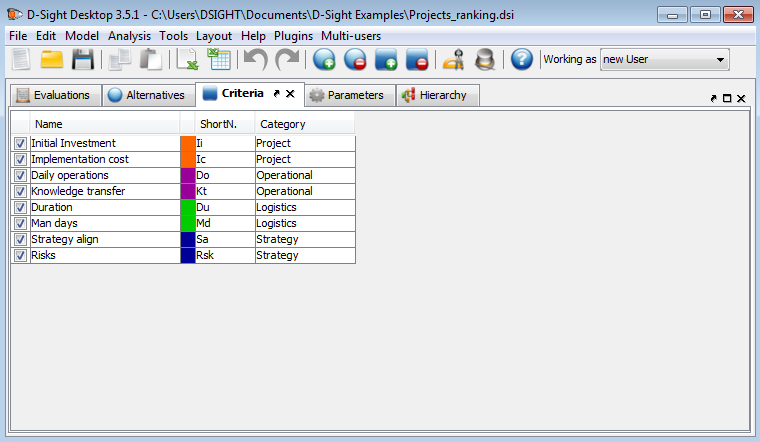
The projects represent the different possible alternatives. They are listed in the Alternatives tab of the start interface. The criteria are listed in the Criteria Tab. Both tabs are illustrated here under.
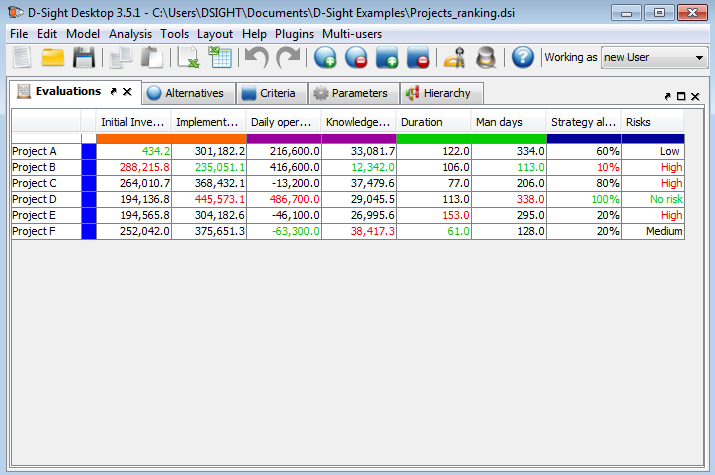
The Evaluations tab is a grid that contains an alternative in each row and the criteria in each column. Basically, the values in that table represent the performances of the projects for each of the criteria. This is shown in Figure 3.
Analysis
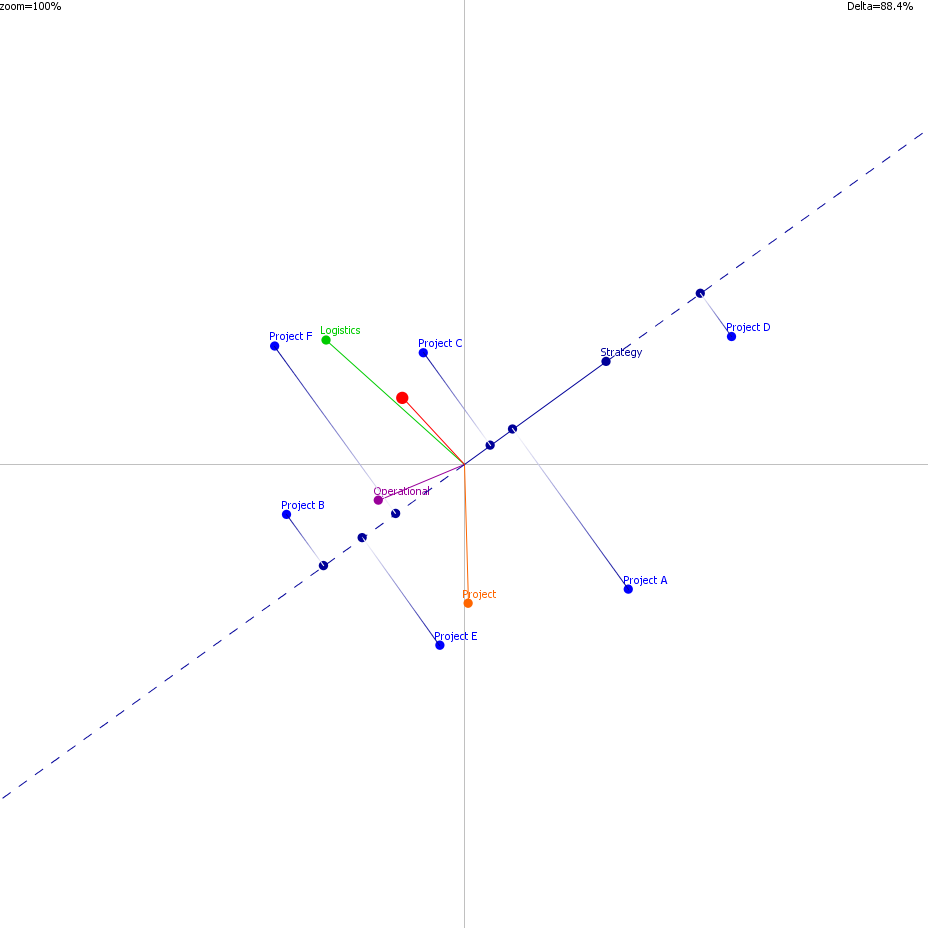
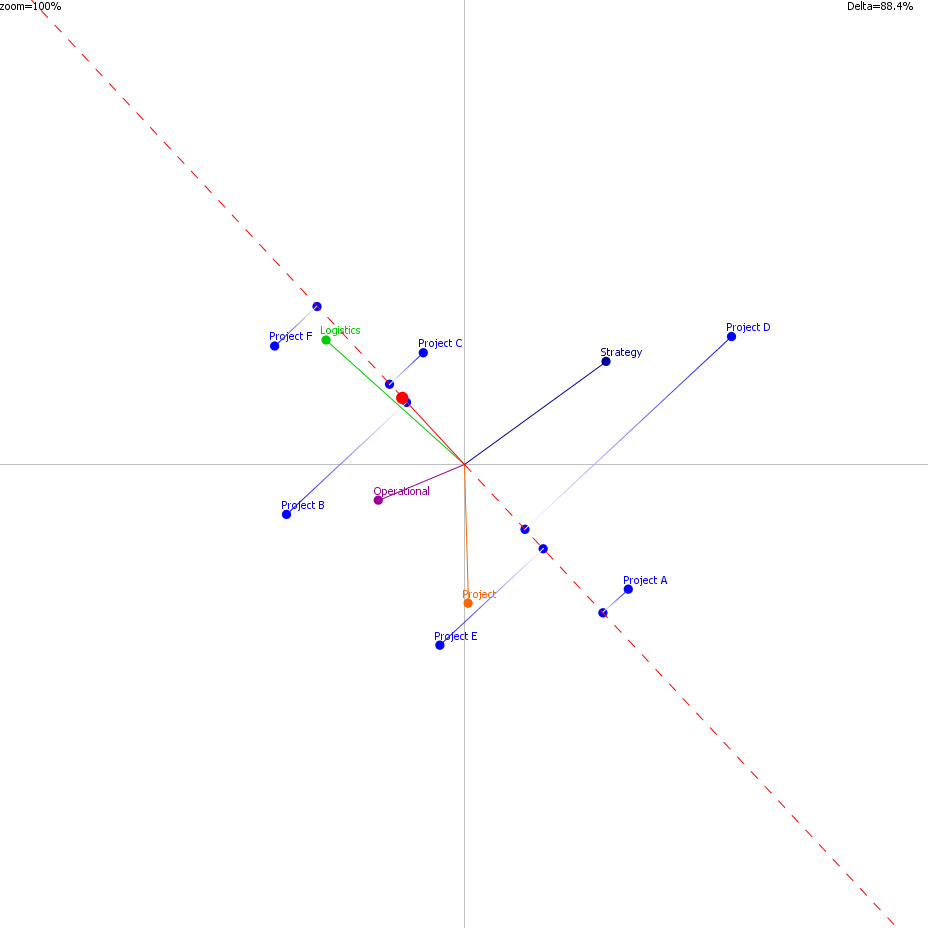
By going into the menu Analysis -> Visualization -> Global Visual Analysis (or CTRL + G), one can see a visual representation of the situation. The projects are represented by the points while the criteria are represented by the axes.If an alternative goes far in the direction of an axis (click on the axis extremity to display the projections), it means that it performs well for this criterion. For instance, the Project D is the best one regarding the Strategy and is followed by the Project A (see Figure 6). On the other hand, the Project D is not good on the Logistics criterion. The Project F is the best for this criterion.If two axes go in the same direction (and are close to each other) that means that the related criteria are correlated! On the other hand, if two axes go in two opposite directions, it means that the related criteria are anti-correlated / in conflict. This latest case can be observed in the present problem where the “Operational” and the “Strategy” axes go in opposite direction. This means that in average and for this specific set of projects, the most ”Strategy aligned” project will be less attractive regarding the Operational aspects. Let’s emphasize that the configuration only depends on the data.The red axis (the one without label) represents the so-called “decision stick”. It represents the direction of the most preferred project. Indeed, it is computed with the weights given by Production Inc and represents the compromise it wants to make among the different criteria. Projecting the projects on this axis (right click on the chart then click on “Stick projections”) will give a visual representation of the ranking. The most preferred projects are F, C and B as one can see in Figure 7.
Let’s open the Global (numerical) ranking by going in into the menu Analysis -> Ranking and click on the Ranking menu item. We do now have the numerical confirmation. The most preferred project is the Project F with a score of 65.43 followed by Project C with a score of 55.19 (see Figure 8).
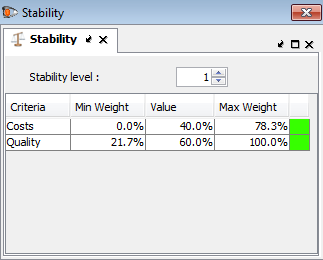
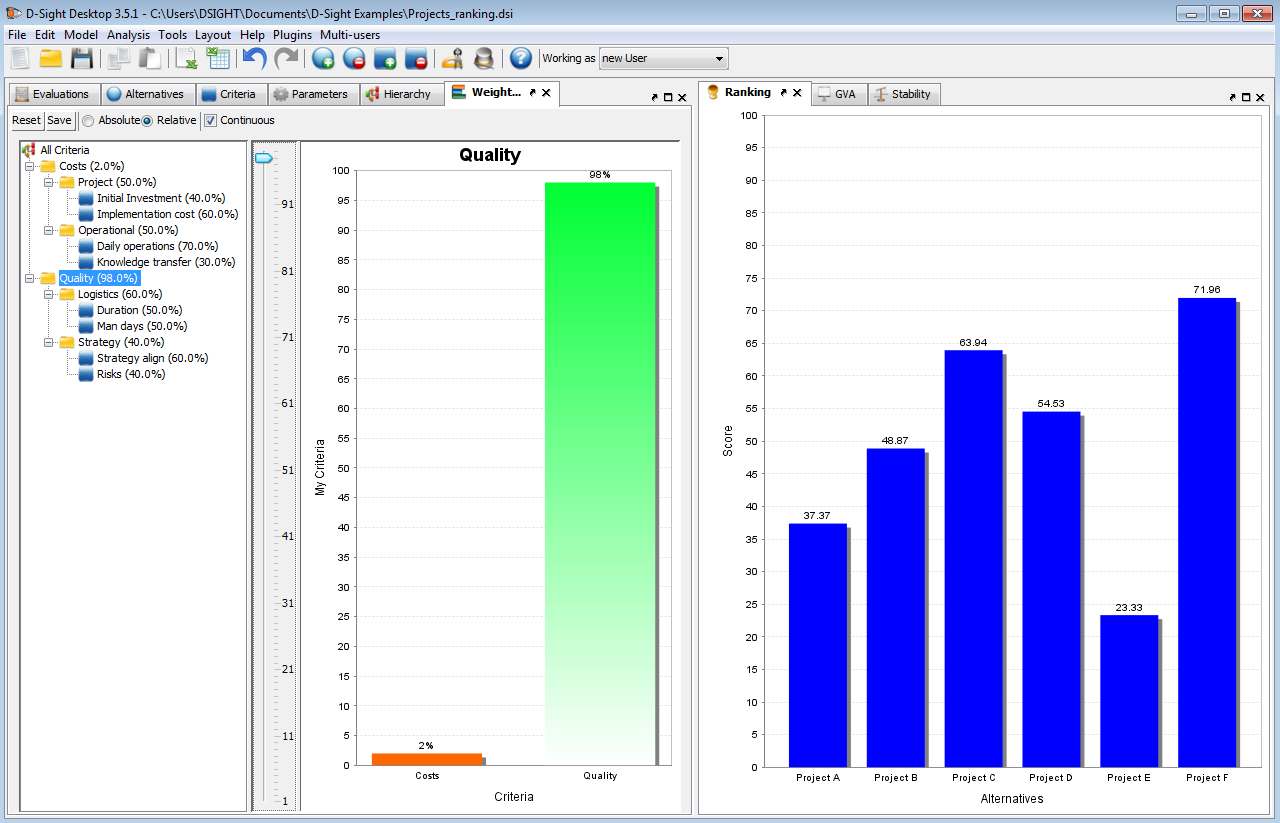
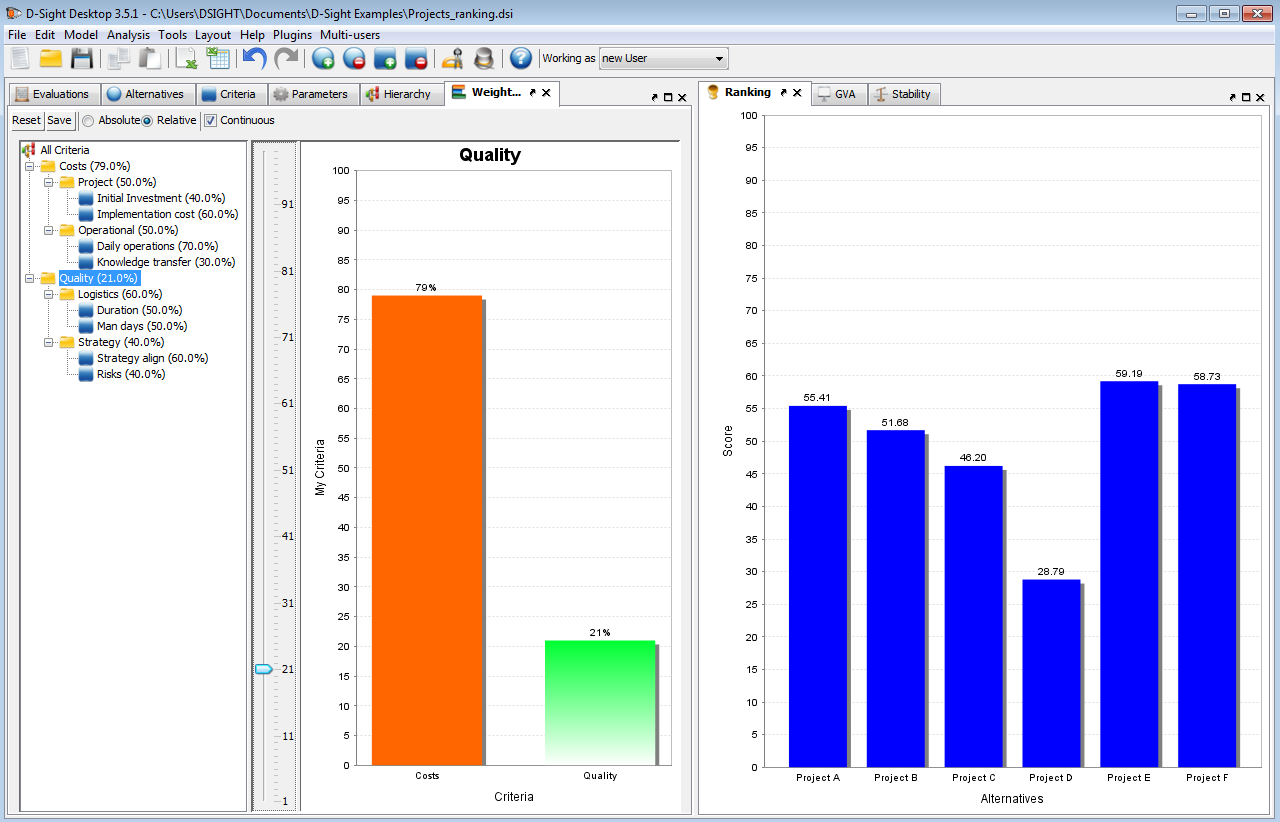
Let’s open the stability intervals tools (Analysis -> Sensitivity -> Stability Intervals). They indicate, for each criterion, in which interval the weight can be changed without affecting the ranking. For instance, one can see that the “Quality” criteria set (which is weighted to 60%) can be changed from 21.7% to 100% without changing the project ranked first. We can check it in real time by opening the walking weights (Analysis > Sensitivity > Walking Weight or Ctrl + W). You can put it in the left part on the main window by drag and dopping it. Select the “Quality” criterion in the tree and move the slider to 100%. For this new weight value, the Project F stays first as it is the best on the global quality aspects. On the other hand lower the importance and you will see that the Project E will come in first position.


